| Year | Total Invested | No Costs | COSTS | Value After Costs | % of Growth Lost |
|---|
Use the free Cost of Cost™ Analyzer to see:
01. What your investments could grow to with no costs
02. What you’ll likely have after costs
03. How much growth is lost due to costs
04. How much growth is lost
• What your investments could grow to with no costs
• What you will likely have after costs
• The total dollars lost to costs
• The percentage of growth taken by costs
It demonstrates Cost of Cost™.
100 basis points = 1%
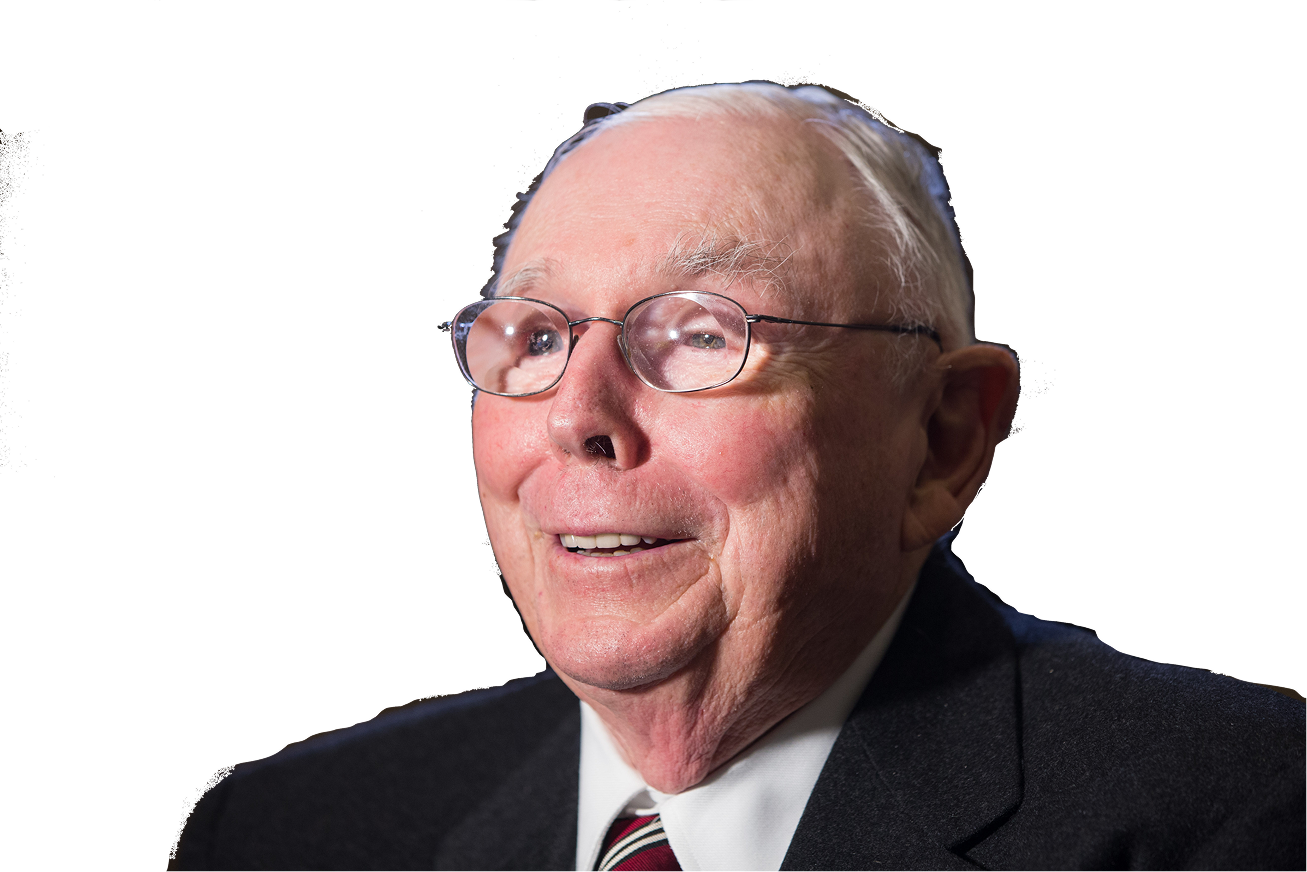
The best thing a human being can do is to help another human being know more.

Charlie Munger
Cost = Your annual advisory and fund costs.
Cost of Cost™ = The compounded growth you lose because of those costs over time.
A 1% difference over 30 years can result in a substantial difference in long-term wealth.
Most investors understand what they earn.
Few understand what they lose to costs over time.
Clarity leads to informed decisions.